
")


CERINA-Investitionsplan für den globalen Klimaschutz
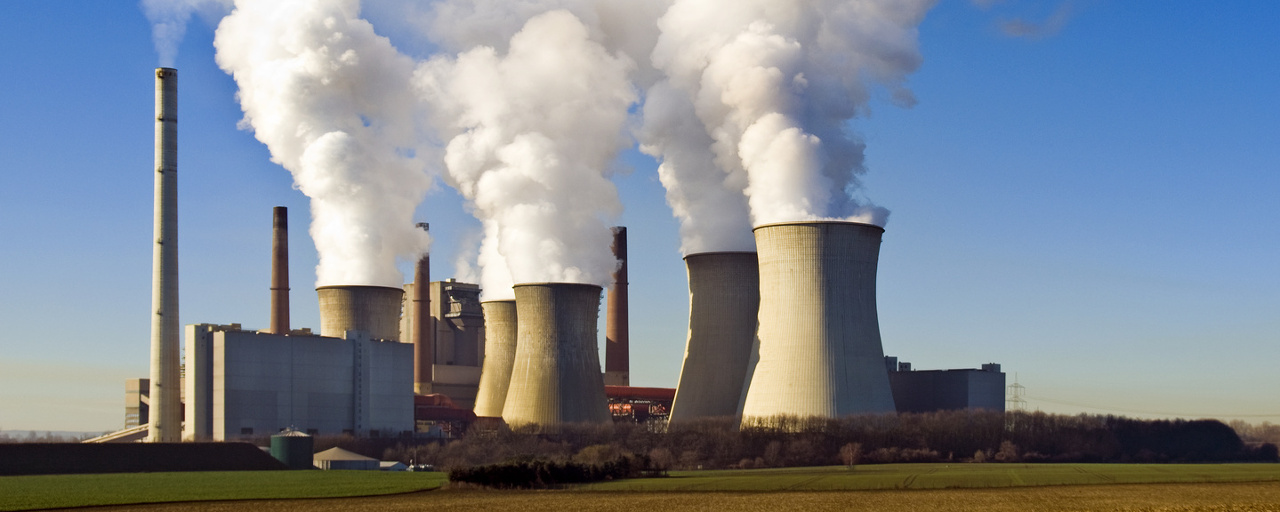
Die weltweiten CO2-Emissionen erreichten im Jahr 2016 insgesamt 35,84 Milliarden Tonnen und liegen damit um etwa 58 Prozent über denen im Jahr 1990. Die steigende CO2-Emissionskurve zeigt überdeutlich, dass sich das weltweite CO2-Problem in der politischen Vergangenheit allein mit dem Begrenzungs- und Bestrafungsgedanken (wie im Kyoto-Protokoll) nicht lösen lässt. Eine Alternative ist der CERINA-Plan (CO2-Emissions and Renewable Investment Action Plan). Konkrete Investitions-Beiträge der Länder kompensieren den globalen CO2-Anstieg.
Pariser Klimaabkommen: Paradigmenwechsel hin zu Beiträgen der Länder
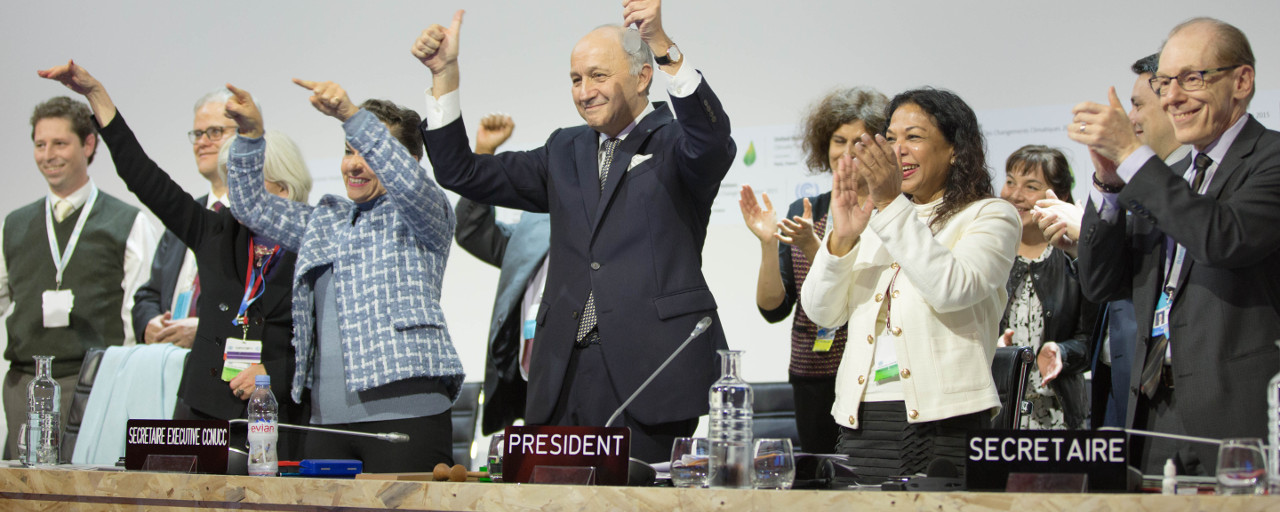
Es ist ein großer Verdienst der Staatengemeinschaft, dass 2015 mit dem Pariser Klimaabkommen die CO2-Obergrenzen-Ära endgültig beendet und ein Paradigmenwechsel hin zum Aktionsansatz vollzogen wurde. Beiträge der Länder zum Klimaschutz stehen erstmals im Vordergrund. Häufig stehen aber qualitative und nicht quantitativen Klimaschutz-Beiträge im Vordergrund.
Dr. Norbert Allnoch vom IWR-Institut für Regenerative Energiewirtschaft hat mit dem bereits 2009 veröffentlichten CERINA-Plan (Allnoch, N. 2009: Conference transcript Renewable Energy Research Association (FVEE) 2009: "Research for Global Renewable Energy Markets", pg. 48 - 50) einen wirtschaftsbasierten Investitionsansatz entwickelt, bei dem die Staaten mit ihren Investitions-Beiträgen (Investitions-Ranking) zum globalen Klimaschutz beitragen. Die Grundidee: Der jährliche globale CO2 Anstieg ist bekannt (ca. 400 - 700 Mio t). Auf dieser Grundlage kann rückwärts gerechnet die Höhe der Investitionen (z.B. in Erneuerbare Energien) ermittelt werden, die notwendig ist, um den globalen CO2-Anstieg zu kompensieren. In einem zweiten Schritt können die einzelnen Beiträge der Länder - in Abhängigkeit von der Höhe des landesspezifischen CO2-Ausstosses und damit verursachergerecht - berechnet und zugeordnet werden.
CERINA-Plan: Investitions-Beiträge der Staaten für den globalen Klimaschutz
Das IWR wirbt mit dem CERINA-Plan aus dem Jahr 2009 für einen - positiv besetzten - Investitionsansatz. Je höher die jährlichen CO2-Emissionen eines Landes, umso höher die „grünen“ Investments im Land (Beispiel:Invest- Ranking und Soll-Ist-Vergleich der Länder 2014). Mit der Idee, die Kopplung der CO2-Emissionen eines Staates an CO2-freie Investitionen (z.B. erneuerbare Energien) zu koppeln, ist ein verursachergerechter und quantifizierbarer Einzelbeitrag der Staaten für den globalen Klimaschutz darstellbar.
Kopplung der CO2-Emissionen an EE-Investitionen - transparente Berechnung
Die Berechnung zur Höhe der „grünen“ Investitionen je Land ist vollkommen transparent: Ist der jährliche globalen CO2-Anstieg bekannt, dann kann rückwärts berechnet werden, wie hoch die jährlichen weltweiten Investitionen in CO2-freie Techniken notwendig sind, um den CO2-Anstieg (das Delta) zu kompensieren. Über einen einzigen Verrechnungsschlüssel (nach IWR-Berechnungen 16 Euro / 19 US-Dollar pro Tonne CO2) lassen sich die Investitionen auf die einzelnen Staaten je nach CO2-Landesausstoß verteilen. Weil die jeweiligen CO2 Emissionen eines Landes bekannt sind, kann der einzelne Investitonsbeitrag über den Verrechnungssatz recht einfach ermittelt werden. Im Ergebnis: Je höher die CO2-Emissionen eines Landes, desto höher die Investitionen. Länder mit einem niedrigen CO2-Ausstoß benötigen geringere Investitionen als solche mit einem hohen CO2-Ausstoß.
CERINA-Investitionsplan: alle Staaten können sich beteiligen
Der CERINA-Plan ist ein neuer Weg und stellt einen wirtschaftsfreundlichen Investitionsansatz zur Stabilisierung bzw. Senkung der weltweiten CO2-Emissionen zum Klimaschutz dar. Ein Investitionsprogramm mit der Schaffung von Arbeitsplätzen ist politisch attraktiver in den Ländern der Erde darstellbar als ein Begrenzungsansatz mit Obergrenzen wie im Kyoto-Ansatz. In großer Vorteil des CERINA-Plans ist es, dass sich durch die Kopplung von CO2-Ausstoß an Investitionen in Erneuerbare Energien grundsätzlich alle Staaten beteiligen können.
Über die CERINA-Plan Initiative
Der CERINA-Plan (CO2 Emissions and Renewable Investment Action Plan) ist als Folge der gescheiterten UN-Klimakonferenz in Kopenhagen 2009 entstanden. Mehr als 10 Jahre nach dem Abschluss des Kyoto-Protokolls im Jahr 1997 und einem rasanten Anstieg des CO2-Ausstoßes war im Ergebnis schon zu diesem Zeitpunkt klar erkennbar, dass die staatlichen Verhandlungen über CO2-Obergrenzen nicht funktionierten. Ursache für die „Kyoto-Sackgasse“ ist letztendlich der zugrundeliegende Begrenzungsansatz über „staatliche CO2-Obergrenzen“, der reflexartig zu Abwehrhaltungen in vielen Staaten führte.
Mit dem CERINA-Plan hat das IWR-Institut im Jahr 2009 ein Investitions-Konzept entwickelt und veröffentlicht, das im Unterschied zu der bisherigen staatlichen CO2-Obergrenzen-Debatte auf konkrete Investitions-Beiträge der Länder zum Klimaschutz setzt. Ein weiterer Zielbestandteil war eine möglichst breite Beteiligungsmöglichkeit aller Staaten.
Die Kerngedanken des IWR-Investitionsansatzes lauten:
- Kennt man den jährlichen globalen CO2-Anstieg, dann kann rückwärts gerechnet die notwendige Höhe der Investitionsbeiträge der Länder in CO2-freie bzw. regenerative Techniken ermittelt werden, um den CO2-Emissionsanstieg zu kompensieren oder zu senken.
- Eine Beteiligung nach dem Verursacher-Prinzip - je höher die CO2-Emissionen eines Landes, desto höher die EE-Investitionen - führt zu einer breiten Akzeptanz.
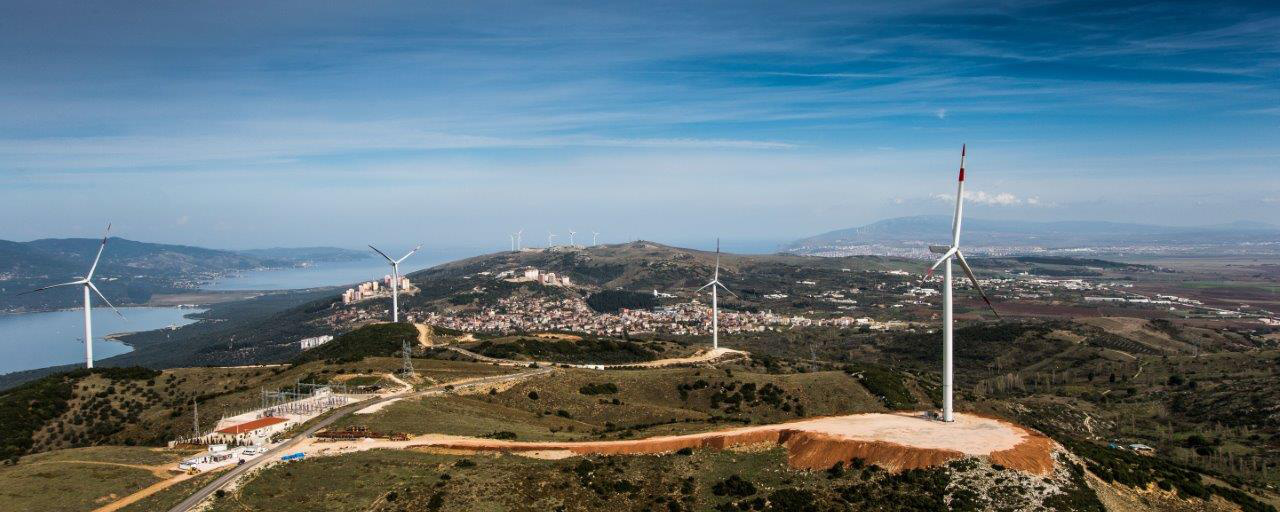
- Regenerative Energietechniken sind in jedem Land einsetzbar, d.h. alle Staaten können sich auch beteiligen.
Die UN-Klimakonferenz in Paris 2015 steht nicht nur für den großartigen Erfolg des weltweiten Klimaschutzvertrags, sondern auch für einen grundlegenden Wandel in der Klimaschutzdebatte. Im Unterschied zu früheren UN-Klimakonferenzen standen erstmals die aktiven Beiträge der Länder zum Klimaschutz im Vordergrund. Mit dem Paradigmenwechsel von Obergrenzen-Debatten hin zu Klimaschutz-Beiträgen ist ein erster Schritt in Richtung des CERINA-Plans umgesetzt worden. Der CERINA-Plan geht jedoch noch einen Schritt weiter und setzt auf konkrete, quantitativ-messbare Investitionsbeiträge der Länder.